Topic 5.7: The H-R Diagram
In about 1910, the Danish astronomer Ejnar Hertzsprung and the American Henry Norris Russell (independently) made a graph that has been the most important chart in stellar astronomy ever since. Plot each star's temperature (or spectral class, or color) against its luminosity (true brightness), and the dots do not scatter at random.
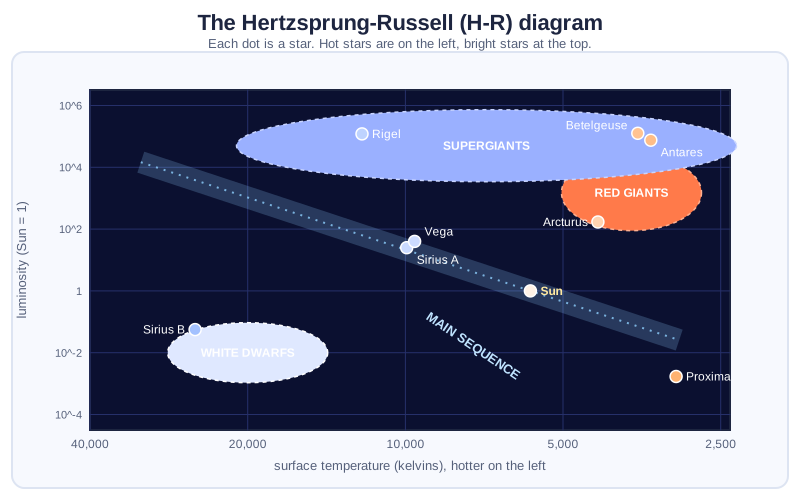
How to Read It
- Horizontal axis: surface temperature. Odd but traditional: hot stars are on the left.
- Vertical axis: luminosity compared with the Sun. Bright stars are at the top.
- Moving right means cooler and redder; moving up means brighter.
The Regions
- Main sequence. The long band from top-left to bottom-right holds about 90% of all stars, including the Sun. These stars are all fusing hydrogen into helium in their cores. Hot blue ones at the top are bright and massive; cool red ones at the bottom are faint and light. Where a star sits on the main sequence depends mainly on its mass.
- Red giants. Upper right: cool but very bright, so they must be huge (Arcturus, 25 times the Sun's radius). They are stars that have used up the hydrogen in their cores.
- Supergiants. The very top: the largest and brightest stars, like Betelgeuse and Rigel.
- White dwarfs. Lower left: hot but very faint, so they must be tiny. (Sirius B is the size of Earth.)
Size Can Be Read From the Diagram
A star's luminosity depends on its radius and temperature (Stefan-Boltzmann law). So a star with the same temperature as a main-sequence star but much more luminosity must be bigger. This is how the sizes of stars that appear only as points of light are worked out.
Mass, Brightness and Lifetime
On the main sequence, mass decides everything. As a rule of thumb:
- Luminosity grows as mass to the 3.5 power. A star with 10 times the Sun's mass is about 3,000 times as bright.
- Lifetime is fuel divided by burning rate, so it falls as mass to the power of about −2.5.
| Mass (Sun = 1) | Luminosity | Main-sequence lifetime |
|---|---|---|
| 0.1 | 0.0003 | trillions of years |
| 0.5 | 0.09 | about 50 billion years |
| 1 (the Sun) | 1 | about 10 billion years |
| 2 | 11 | about 1.8 billion years |
| 10 | 3,000 | about 30 million years |
| 50 | 880,000 | about a million years or less |
The brightest stars live the shortest lives. The blue giants we see in Orion and the Pleiades are, by this model, young.
Using It
Astronomers use the H-R diagram to find distances: measure a star's color to find where it lies on the main sequence, read off its luminosity, compare with how bright it looks, and the inverse-square law gives the distance (spectroscopic parallax). They also use clusters: stars in a cluster formed together, so the point at which the main sequence ends (the turnoff point) tells the cluster's age.

(A note on timelines: the lifetimes and ages in this lesson come from the standard model of how stars work, which is tested by physics we can measure today. Many Christians who study science accept those ages; others, including creation scientists, hold to a much younger universe. How a star shines, how bright it is and how hot it is do not depend on that debate. We give the numbers because they appear in textbooks and tests, and so you can recognize them when you meet them.)
Worth a Pause
Paul wrote, "There is one glory of the sun, and another glory of the moon, and another glory of the stars: for one star differeth from another star in glory" (1 Corinthians 15:41). He was talking about something else, the glory of the resurrection body, but the H-R diagram would have impressed him as an illustration. No two stars are alike, and yet the whole crowd falls into a few orderly families. Variety and order together: that is a good description of the creation as a whole.
Try It: H-R Hunter. Find the main sequence, giants and white dwarfs on the H-R diagram and compare famous stars. Play H-R Hunter »
Practice Problems
- What two properties are plotted on an H-R diagram?
- Why do hot stars appear on the left side?
- Which region of the diagram holds the Sun? About what fraction of stars are in that region?
- A star is cool (red) but very luminous. What kind of star is it, and what does that say about its size?
- A star is hot (blue-white) but very faint. What kind of star is it?
- Why do massive main-sequence stars have shorter lives than low-mass ones?
- A star has 10 times the Sun's mass. About how bright and how long-lived is it, compared with the Sun?